
How Much Does Commercial Liquidation Cost in Canada? A 2026 Pricing Breakdown
What drives commercial liquidation pricing in Canada: the four cost variables, the pricing models, and the questions to ask before signing any quote.
How Much Does Commercial Liquidation Cost in Canada? A 2026 Pricing Breakdown
There is no single price for commercial liquidation in Canada. The cost is a function of asset mix, project size, geography, and timeline, not a flat per-day rate. The headline on any quote is labour, tipping, and transport. The number that actually matters is the net, after the recovery side is counted. This piece walks through the cost structure, the variables that move it, and the questions that separate a transparent quote from an opaque one.
The Cost Structure Underneath Every Quote
A commercial liquidation quote in Canada breaks into four cost components. Labour covers sorting, removal, dismantling, and packing, and it is the largest line item on most projects. Disposal and recycling covers tipping fees, e-waste processing under EPRA programs, and hazardous handling. Transport covers trucks, loaders, and freight to disposal or buyer destinations. Vendor margin and project management covers coordination, reporting, certificates, and the liquidator's fee structure.
What separates liquidation from pure disposal is the credit side: recoverable value from resale into the secondary market. For most projects with meaningful inventory value, recovery offsets total cost. On some, recovery exceeds total cost, and the engagement ends with cash to the business instead of an invoice. A quote without a recovery estimate is not a complete picture of the cost. Cost and net cost are different numbers, and net is the one to negotiate against.
The Four Variables That Move the Price
Every commercial liquidation quote in Canada is shaped by four inputs.
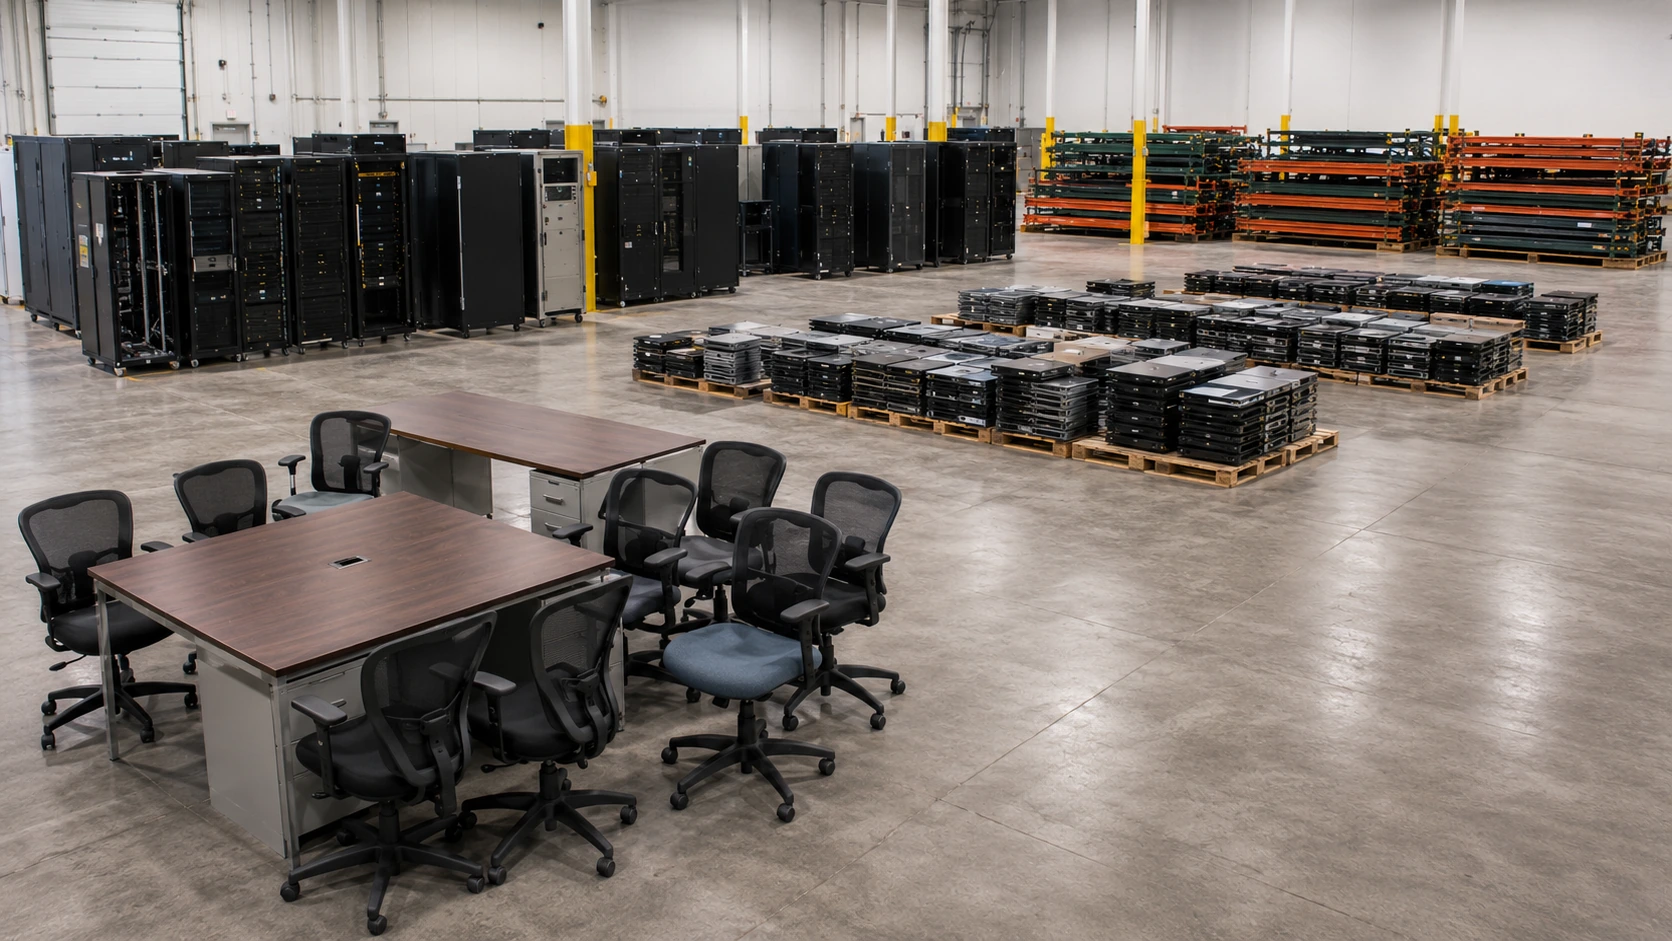
1. Asset mix. Office furniture liquidation, IT equipment, warehouse racking, and industrial machinery have different labour profiles, disposal pathways, and recovery values. A pure IT project costs less to physically move but more to handle compliantly. A warehouse with heavy racking and machinery costs more to dismantle but recovers more from resale.
2. Project size. Mobilization cost is largely fixed. A small pickup and a multi-floor strip-out use different crew sizes, but per-unit cost drops sharply as size grows. Most Canadian liquidators have a minimum project value below which a project does not make economic sense.
3. Geography. Provincial labour rates, tipping fees, distance to disposal and buyer destinations, and access to secondary markets all shift the math. Toronto, Vancouver, and Calgary have the most developed secondary markets, which raises recovery and lowers net cost. Commercial moving labour in the GTA runs $130 to $160 per hour for a two-person crew per published Toronto moving industry pricing data for 2025-2026.
4. Timeline. Standard projects with adequate notice cost less than rush jobs. Last-minute mobilization adds labour premium, and recovery falls because the resale window compresses.
These variables compound. The most expensive per-unit project is small, rushed, single-asset, and rural. The lowest per-unit cost comes from a large, well-planned, mixed-asset project in a major metro.
Pricing by Asset Type: What to Expect Conceptually
Different asset categories behave differently on the cost side and the recovery side.
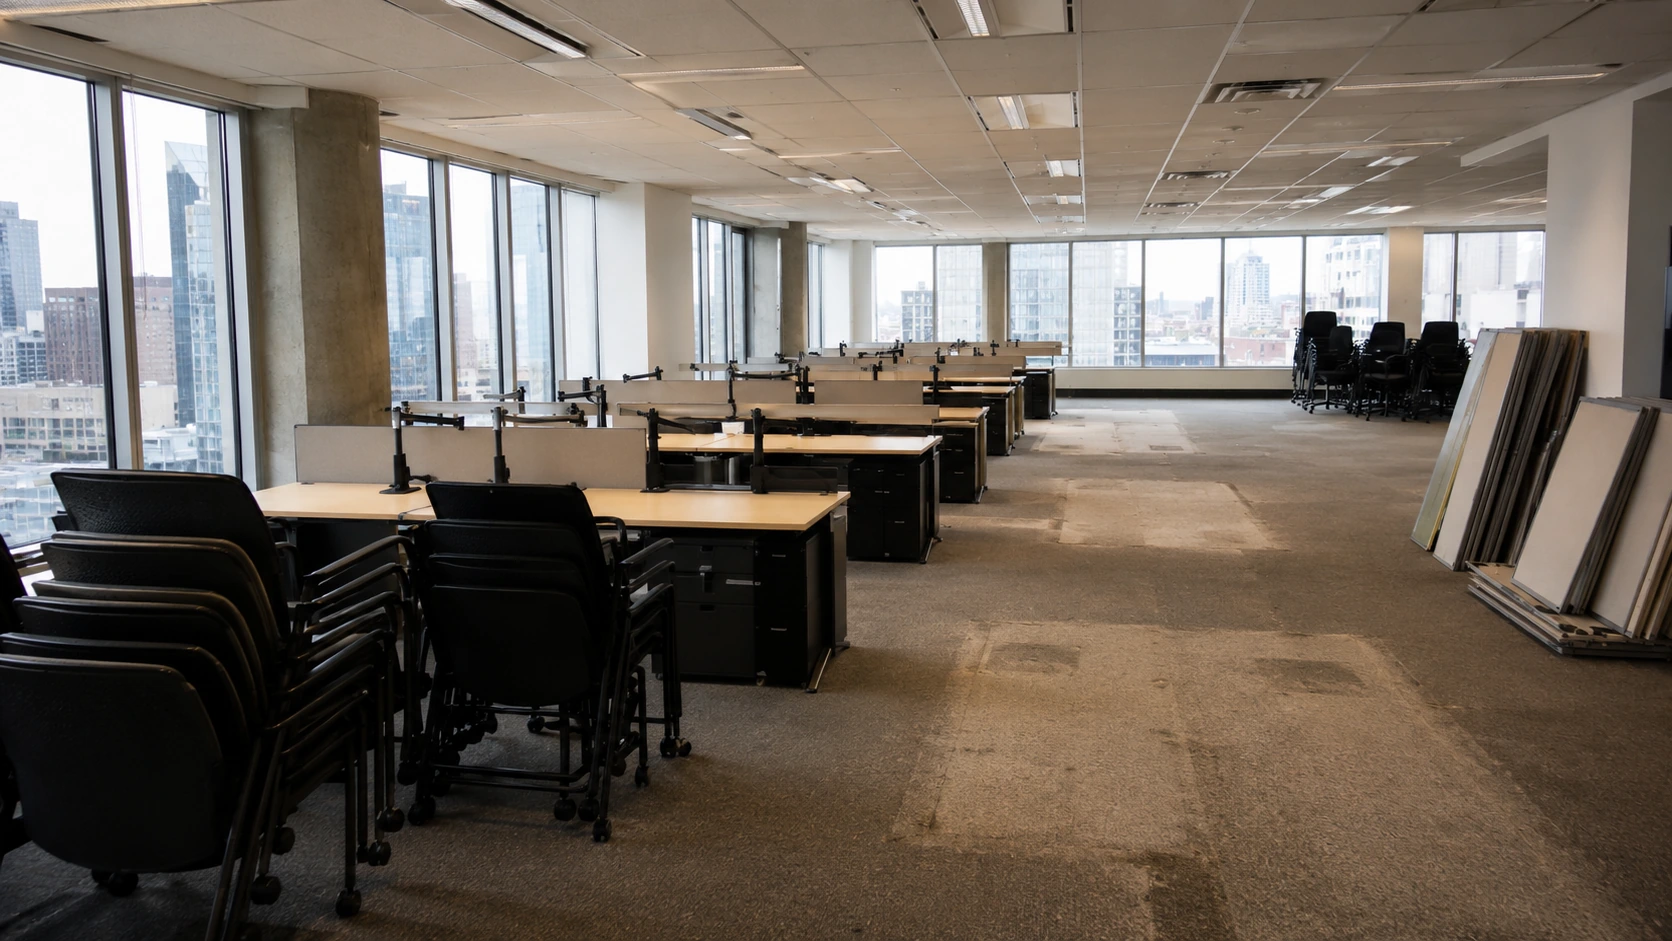
Office furniture is the highest-volume liquidation category in Canada by project count. Premium task chairs from recognized brands hold meaningful resale value through national secondary-market channels (for example, used Herman Miller Aerons commonly resell for $350 to $850 each depending on configuration and condition), and industry depreciation benchmarks place commercial office furniture retention at roughly 30 to 40% of value after 5 years.
IT equipment carries higher per-unit recovery on recent business-grade devices but stricter compliance overhead, with data destruction following NIST Special Publication 800-88 Revision 2 guidelines for media sanitization plus PIPEDA. Recovery on recent fleets routinely exceeds the disposal-only cost for the same equipment.
Warehouse and industrial assets show the widest recovery swings. A single high-value asset such as a CNC machine or a forklift fleet can move the net by tens of thousands. Pallet racking, conveyor systems, and material-handling equipment have active secondary markets when the equipment is in serviceable condition.
The per-project pricing on any specific engagement is best resolved through a walkthrough, because the assumptions in any published range will differ from your actual asset mix.
Pricing Models in Practice
Canadian liquidators commonly use three pricing structures.
Fixed fee. The liquidator quotes a flat amount based on the inventory and the work scope. The client pays the fee; any recovery from resale flows through to the client. Fixed fee is the most predictable structure for the client and is common on smaller projects where the recovery side is modest.
Net-of-recovery. The liquidator takes a percentage of resale recovery in lieu of a fixed fee. The two parties' incentives align: the liquidator earns more when the business earns more. Common on mid-size and larger projects where recovery is meaningful.
Free-to-tenant. On the largest projects with high-recovery assets, the liquidator takes the work at no cost to the business and recovers entirely through resale. Possible only when the asset profile supports it.
The right structure depends on project size and asset mix. Fixed fee tends to favour the liquidator on high-recovery projects; net-of-recovery tends to favour the client. A quote that does not explain the structure is one to push back on.
Pricing by Province in Canada
Provincial cost differences are smaller than people assume, but they matter on tight projects. Ontario and the GTA set the baseline. Quebec, BC, Alberta, and the Prairies see modest variation in labour rates, tipping fees, and secondary-market access. Atlantic Canada and rural regions see higher transport costs and thinner secondary markets, partly offset by lower disposal rates.
A liquidator with a national buyer network can compensate for weaker local markets by routing recovery into higher-demand regions. The current Canadian commercial real estate market reinforces the demand pattern: CBRE Canada's Q4 2025 Office Figures report Toronto led downtown vacancy declines, with 1.0 million sq ft of sublease space coming off the market in Q4 2025 alone. The national network matters more for recovery than local labour costs.

What to Ask Before Signing a Quote
Five questions separate transparent quotes from opaque ones.
- Pricing structure: Fixed fee, net-of-recovery, or hybrid? Each has trade-offs. Mid-size and larger projects usually do better under net-of-recovery.
- Scope inclusions: What is included, and what is billed separately? Reinstatement, drywall, certified data destruction, e-waste reporting, and Certificates of Destruction frequently sit outside a basic quote.
- Recovery assumption: What recovery estimate does the quote assume, and what happens if it lands higher or lower? A trustworthy quote shows the math both ways.
- Disposition plan: What happens to unsold items? A reputable liquidator routes through donation and certified e-waste recycling before disposal, with a written final disposition report.
- Timeline: What changes the price if the calendar compresses? Rush jobs cost more. The quote should state both calendars.
A quote that does not separate cost from recovery is hiding something. A quote that does not list disposition pathways for unsold items is hiding something else.
How Michael's Global Trading Prices a Project
When Michael's Global Trading is asked to quote a commercial liquidation, the walkthrough produces three numbers, not one: estimated cost, estimated recovery, and the net. We work in fixed-fee on smaller jobs and net-of-recovery on mid-size and larger projects, choosing the structure that minimises net cost to the client. The quote shows the full math, including labour, transport, tipping, disposal, and recovery, so the decision-maker sees where the dollars go.
Our commercial asset liquidation work covers Toronto and the GTA, Ottawa, Montreal, and businesses across Canada. We handle office furniture, IT and ITAD, warehouse, and industrial projects under a single point of contact, with chain-of-custody documentation and landfill diversion reporting included.
Frequently asked questions about commercial liquidation pricing
Is there a typical price per square foot for commercial liquidation in Canada?
Commercial liquidation pricing does not reduce cleanly to a per-square-foot benchmark because asset density and recovery vary too widely. A 10,000 sq ft office with a heavy fit-out of premium furniture and IT looks very different from a 10,000 sq ft warehouse with light inventory. A project-specific walkthrough is the only reliable way to scope the cost.
What hidden fees do Canadian businesses commonly miss?
Reinstatement to base-building condition, certified data destruction for IT, e-waste compliance fees under EPRA programs, and after-hours premiums are the most common omissions on competitor quotes. Ask whether each is in scope.
What is the difference between cost and net cost?
Cost is the gross expense (labour, tipping, transport, fees). Net cost is gross expense minus recovery from resale and donation. On most mid-size and larger Canadian commercial projects, net cost is significantly lower than gross.
Can commercial liquidation be free to the business?
On large projects with high-recovery assets, yes. Some Canadian liquidators take the work at no cost to the tenant and recover entirely through resale. This is most common in large office decommissioning and high-fixture retail closure scenarios.
Do small businesses have access to the same pricing structures?
Small projects typically pay flat fees because mobilization economics do not support net-of-recovery. The break point varies by market and by asset mix.
Quick Recap
- Four cost drivers: Asset mix, project size, geography, and timeline. Asset mix and size matter most.
- Two sides of the ledger: Gross cost (labour, tipping, transport, fees) versus recovery from resale. Net cost is the right number to negotiate against.
- Three pricing models: Fixed fee, net-of-recovery, and free-to-tenant. The right structure depends on project size and asset mix.
- Geography moves the math modestly: A national buyer network matters more than local labour rates.
- Five questions surface a transparent quote: Pricing structure, scope inclusions, recovery assumption, disposition plan, and timeline.
Ready to See the Math on Your Project
There is no average price for commercial liquidation in Canada. There is only the price for your specific project, with your specific asset mix, size, and timeline. Michael's Global Trading provides commercial asset liquidation to businesses across Toronto, the GTA, Ottawa, Montreal, and the rest of Canada. Contact us to walk your facility and get a custom quote based on your actual asset inventory before you sign anything.
Recommended readings
Office Furniture Liquidation vs. Disposal: A Cost Comparison for Canadian Businesses
What Does a Commercial Liquidation Company Actually Do? A Process Breakdown
Recommended readings:


Blogs & News
Get started on
your journey with us.